|
|
Contours from Intercepts - Example generate-controls-from-holes-intercepts worked example |

Drillhole Intercept Contours - Example
Generate contour strings from an input desurveyed drillholes data object.
This method of contouring involves interpolation of a surface map between drillhole intercept positions. This function makes use of the generate-contours-from-holes-intercepts command.
Contouring Drillhole Data
The input to this function is a loaded drillhole object. The following optional inputs are also supported:
- Strings to indicate fault lines and/or clipping regions
- Additional point data in the form of actual points or string vertices
The command optionally generates an output string file containing contours at nominated elevations, a grid model and/or a wireframe surface object.
It is not possible to generate a distance-from-samples style contour map with this command.
This tool supports the following:
- Choice of different interpolation algorithms
- Choice of highest or lowest elevation maps
- Anisotropy
- Data smoothing
- Region clipping
- Faulted data
- Smooth contour lines
- Gridded data output
- Surfacing
Contouring Point Data
The input to this function is a loaded points object. The command optionally generates an output string file containing contours at nominated elevations, a grid and/or a wireframe surface object.
For more general information, see Contours from Points - Introduction
|
|
This function will default to overwriting the current object (string, model or wireframe) when it outputs data. You can create your own objects as part of this procedure, or you can choose to create the output objects manually first (using the Current Object toolbar) then select them on the Output Data screen. It's up to you. |
Example - Creating a Lithology Contour
This example makes use of data from the "DmTutorials" demonstration data set. This is normally located here:
- C:\Database\DMTutorials\Data\VBOP\Datamine
The file that is used throughout this example is _vb_holes.dm, a simple example drillhole set containing a lithology attribute representing various rock types.
In this example, the Siltstone rock type is modelled (highest elevation of an interval). This example does not use fault or boundary clipping strings, and outputs contour strings at given intervals and an interpolated surface.
- Unload any previously loaded data.
- Load the drillholes file (_vb_holes.dm) into the 3D
window:
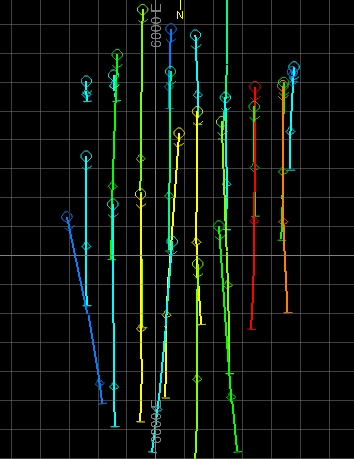
- Run the command generate-contours-from-holes-intercepts
- The Generate Contours wizard is displayed.
- In this example, you are going to consider the full loaded object, although this command does support pre-selection (see Contours - Data Page (Intercepts))
- As faults and clipping polygons are not used in this example, the only section to complete is Drillhole Data: the [_vb_holes (drillholes)] Object will already be selected.
- In the Contour attribute list, select [LITH~2].
- In the Value list, select [Siltstone].
- Ensure the Highest Elevation option is selected.
- For this example, you're not going to include additional points or faults data, so the Point Data and Faults radio buttons should be set to None.
- Click Next.
- The Gridding page is displayed. The Extents section determines the scope of your contouring. By default, data extents are used, meaning the minimum and maximum values of the loaded drillholes file are shown as read-only values. You can edit them using the Custom option if you wish.
- The Margin setting
is the amount by which the contours (and surface) are extended
beyond the original data hull. The Margin works in conjunction
with the Reset grid size from
data button; when the button is pressed, the Margin
is added to the data extents before copying the Min
and Max values shown.
The generated grid always uses the Min and Max values regardless or any intermediate changes to margin (although the actual grid max may be rounded up to the next whole cell size).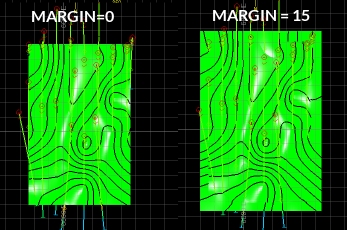
- The Resolution area
lets you define the grid cell size or number of grid cells. This
is like the NGRID parameter
used in implicit modelling commands; it increases or decreases
the distance between grid points. This example procedure doesn't
output a grid model, but if it did:
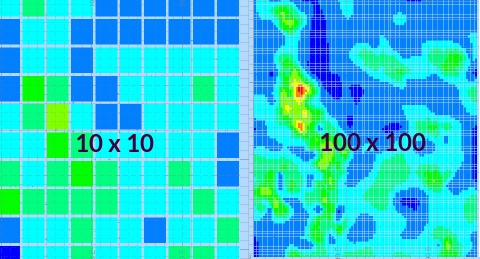
- If setting the Cell Width and Height, higher numbers will reduce the inter-point distance of the grid.
- If setting the number of Cells Across and Up, higher numbers increase the distance.
- Estimation parameters determine how the surface is generated
between points. The options are:
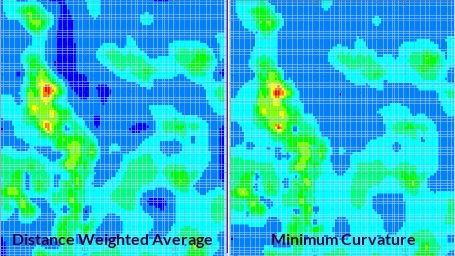
- Distance Weighted Average: the estimate is the average of sample values used by weighting the inversely to the square of their distance from the node.
-
Minimum Curvature: this is also an inverse distance weighted average method, but also uses slope information at the node being estimated.
-
Trend Surface: use a polynomial projection method to interpolate a trend surface between points. Select the polynomial order to determine the type of calculation performed.
-
Set your estimation method. For the majority of cases, the default [Slope] setting is fine.
-
Similarly, there are multiple Smoothing options available for your contours (this will have no effect on the output grid model if one were created). The [Biharmonic] option will apply a sensible smoothing level to most inputs and parameters e.g.:
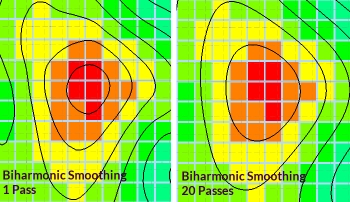
-
Support is also provided for anisotropy; you can define a search ellipse if you wish to capture a directional trend in your data. In this example, there is no anisotropic trend so no search ellipse is required.
-
Click Next to display the Output Data screen.
-
Set the Interval (distance in Z between contours) and the Offset (an offset value from the mean position of the highest and lowest elevation values). For this example, select "5" as the Interval and leave the Offset at zero.
- If you wish to constrain the contours generated to upper and
lower values, you can select the Custom
option and set the Lowest
and Highest elevation
values accordingly. The Interval
does not have to be a precise factor of either the Lowest
or Highest value.
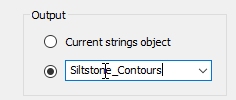
For this example, select the Custom option and change the Lowest value to "-20" and the Highest value to "60". - You can create objects with this command; change the Output option to the lower
radio button and enter the description "Siltstone_Contours"
into the editable field:
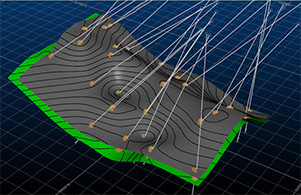
- You're going to create contours (and a corresponding interpolated
surface) that line up with the positions of the drillhole intercept
positions (with a small tolerance). As such, you need to ensure
the Elevation of the points of the string and wireframe use the
intercept positions of the Contour
attribute.
In the Elevation group, ensure Use attribute option is selected. An alternative would be to set a fixed elevation for a flat contour map (using Below data). - For this example, an output grid model won't be created. Instead, select the Output surface check box.
- Enter a Tolerance of "0.01". This gives the surfacing engine a small range of flexibility when creating a surface between points.
- Change the "New surface" description to "Siltstone_Surface" and click Finish.
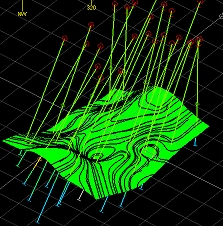
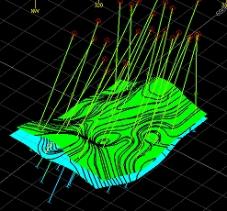
- You should now be looking at a new wireframe and strings object.
Color the drillholes on LITH~2 using the Drillhole Properties
dialog:
- Repeat the process above to create a surface at the Lowest
Elevation (Input Data page) - use "-30" for the
Lowest string and "40"
for the Highest string
(Interval = "5")
and store the output in a new wireframe object. Color each differently,
e.g.:
For more information on generate-contours-from-holes-intercepts, please see Related Topics, below.
|
|
An online tutorial covering all of the contouring commands in Studio can be found here: https://datamine.freshdesk.com/support/solutions/articles/19000080828-contouring-tutorial (Internet connection and Datamine Support Portal login required - contact your Datamine representative if you need assistance). |

|
|
Related Topics |
|
|
generate-contours-from-holes-intercepts
generate-contours-from-points Contours from Points - Introduction Contours from Points - Procedures |
Copyright © Datamine Corporate Limited
JMN 20045_00_EN